In 2020, The National Center for Microscopy and Imaging Research (NCMIR) embarked on a project, supported by the NIH’s National Institute of Aging, to accelerate and scale the acquisition, processing/refinement, and dissemination of large-scale 3D EM data derived from a remarkable collection of legacy, human biopsy brain samples from patients suffering from Alzheimer’s Disease (AD). These biopsies were collected and exquisitely preserved for EM analysis by acclaimed neuropathologists Drs. Robert Terry and Suzanne Mirra, in the 1960s and 1980s, respectively.
The Alzheimer’s 3DEM Database is a community portal for open access to the newly acquired reference 3D EM data sets produced by NCMIR (and reprocessed legacy datasets), along with example derived data products (e.g., fully segmented neurons and their intracellular constituents, including classic hallmarks of AD progression), and tools to enable further data exploration, visualization, and automated analysis.
Samples:
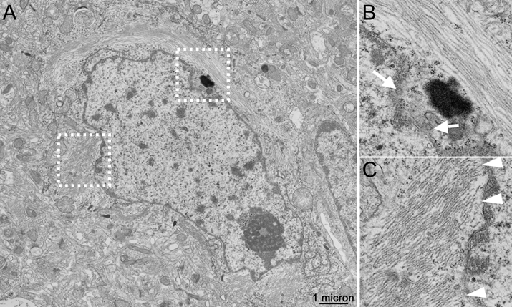
The samples have all been screened and manifest near perfect preservation of ultrastructure (see an example TEM micrograph below), showing PHF and amyloid accumulations as well as modifications to subcellular organelles and cytoskeletons of the cell bodies, axonal and dendritic processes.
Figure 1. (A) Example transmission electron microscopy (TEM) micrograph of AD biopsy samples of cerebral cortex, showing excellent ultrastructural detail, including nuclear pores (white arrows in panel B, corresponding to white box in A) and microtubules, as well as examples of associations of paired helical filaments (PHF) with the membranes of the nuclear envelope (white arrowheads in panel C, corresponding to white box in A). The imaging studies which produced these data, originally conducted by us in the late 1980s, also highlighted associations of PHF with ribosomes, differences between the distribution of the Golgi apparatus in neurons containing PHF bundles, as compared to nearby and otherwise normal-appearing neurons without these filaments. Abnormalities in the microtubules were also documented in axonal processes that touched neuritic plaques.
Using modern, correlated X-ray and high throughput 3D EM methods, we are now performing a more extensive and detailed analysis of these AD samples. Our work includes the use of powerful deep learning-based approaches to rigorously and quantitatively extract detailed information about inter-organelle associations and cytoskeletal reorganization associated with neuronal degeneration of the type found in AD. Early 3D EM (1980s), employing serial section TEM, yielded remarkable reconstructions of cortical neurons representing multiple stages of AD progression (see Figure 2 below). Leveraging modern, higher-throughput techniques, we are scaling these initial efforts and openly sharing these data (and derived data products) to provide the community with a reference collection to seed follow-on investigation.
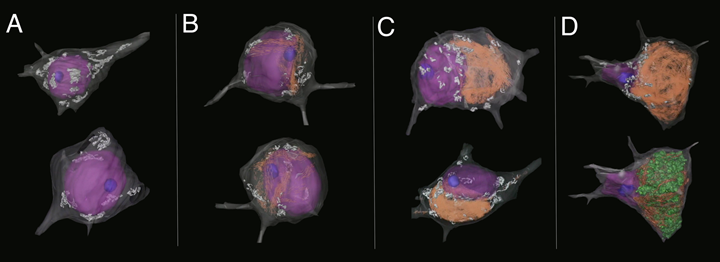
Figure 2. Collection of manually segmented and surface rendered neurons from a single AD patient biopsy sample of cerebral cortex, imaged from serial sections by the Ellisman group using TEM. Panels (A-D) show cells which are representative of the progression of AD, from: (A) healthy/tangle-free, (B), early aggregation of PHF (shown in orange), (C) intermediate aggregation of PHF and obvious changes in cellular distribution of the Golgi apparatus (shown in white), and (D) an extremely compromised, near end-stage cell with extensive PHF aggregation and lipofuscin (LF, shown in green) accumulation. Here, the cell nucleus (shown in purple) is completely dislocated to the periphery of the cell. These early reconstructions allowed for qualitative assessment of the cytoskeletal disruption in cells associated with the progression of AD. Our goal is to reimage and apply modern image segmentation techniques to allow for a more rigorous and quantitative assessment of changes, to be openly shared along with the tools/workflows that were applied to obtain and analyze these data. Legend: grey=plasma membrane, purple=nucleus, blue=nucleolus, orange=paired helical filaments, white=Golgi apparatus, and green= lipofuscin.
Imaging methods
Survey Techniques:
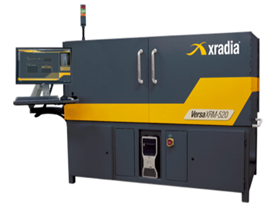
Zeiss/Xradia Versa 510 XRM
3D X-ray µCT: 3D X-ray µCT allows for the 3D survey of our embedded human brain samples ahead of EM sectioning. The volumetric maps produced by the XRM are detailed enough to yield gross landmarks ( e.g., blood vessels, cells, etc.) sufficient to guide follow-on imaging, allowing for automated tracking of regions-of-interest and improving overall decision making. The Zeiss/Xradia Versa 510 delivers submicron resolution at large working distances, making it an ideal, non-destructive survey tool for our purposes.
Widefield Scanning EM 2D Image Surveys:
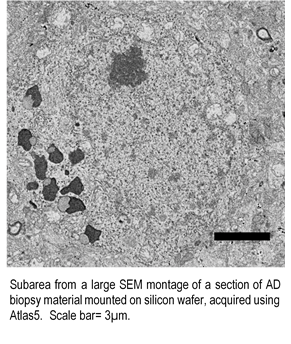
We find it useful to also collect detailed 2D surveys of the complete biopsy tissue block using an image montaging strategy in the SEM. Our Zeiss GeminiSEM 300 SBEM platform is equipped with Zeiss’ Atlas5TM system allowing for fully automated, high-resolution, large-area imaging (montaging) of serial sections mounted on silicon wafers. With an initial full image survey of the sample blockface, we further increase the efficiency of identifying interesting cells and other regions of interest for 3D EM. With the sections on silicon, we also gain the ability to post-stain (e.g., with uranyl acetate and lead, or more aggressive strategies), allowing us to boost contrast.
3D EM Methods:
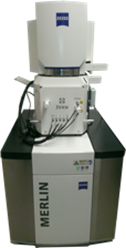 Zeiss Merlin Gemini SEM 450
Serial Section 3D Scanning EM (Array Tomography): Beyond widefield 2D survey, with Atlas5 TM, we have the ability to collect 3D data with high-throughput from an array of serial sections mounted on silicon wafers. This method is advantageous as, in addition to enhanced staining, the sections on wafers can be re-imaged/re-probed multiple times.
Serial Blockface Scanning EM: SBEM is a rapidly proliferating technique that allows for the imaging and reconstruction of large expanses of brain tissue (tens of thousands of cubic microns) at nanometer-scale resolution. SBEM consists of a computer-controlled ultramicrotome fitted into the scanning electron microscope. With SBEM, an oscillating diamond knife removes a very thin (20-100 nm) layer from the epoxy embedded sample surface, which is then imaged using backscattered electrons. This process is repeated hundreds or even thousands of times sequentially in an automated manner until the desired volume of tissue is traversed. NCMIR recently developed and introduced a new approach to SBEM that uses focal nitrogen gas-injection over the sample block face surface to eliminate sample charging while allowing high vacuum to be maintained in the specimen chamber, resulting, in a significant improvement in both SNR and resolution for specimens not intensely stained with heavy metals. By and large, our brain biopsy samples from AD patients were prepared using conventional EM fixation, staining and processing protocols and did not employ the multiple en bloc heavy metal staining protocol developed to propel high-resolution SBEM. With focal charge compensation, however, we can achieve excellent image quality with resolution sufficient to resolve microtubules and synaptic vesicles.
Multi-tilt, Serial Section IVEM/STEM Tomography: For targeted regions-of-interest, individual (or serial arrays of) sections can be imaged at much higher resolution in the intermediate-high voltage TEM (IVEM) using advanced EM tomography methods pioneered at NCMIR, in either TEM or STEM modes. Employing automated multi-tilt data acquisition, tilt-series processing, and alignment, we routinely assemble electron tomographic data from a greater number of tilt series (4 to 16), yielding enhanced data quality and improved contrast for weakly stained structures. This scheme facilitates visualization of nanometer scale details of fine structure in volumes from our plastic-embedded samples in all dimensions.
 FEI Titan 80/300 IVEM/STEM