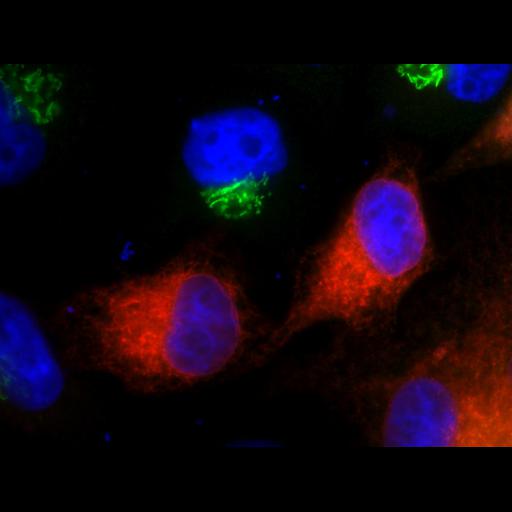
HeLa cells transiently expressing GlcNAcT-1-HA-KDEL were fixed, immunolabeled for GlcNAcT-1-HA-KDEL (red) and endogenous alpha-mannosidase II (ManII, green), and examined by fluorescence microscopy. Endogenous ManII displayed different staining patterns, depending upon the level of expression of GlcNAcT-1-HA-KDEL. In this image, GlcNAcT-1-HA-KDEL was highly expressed and ManII protein was lost, presumably due to ER degradation. Other images in Fig 6 show ManII localization to the Golgi (CIL# 13656), or to the ER (CIL# 13655). Transfected HeLa cells were fixed in 3% paraformaldehyde, blocked with 0.2% Triton X-100, 1% FBS, 0.5% BSA in PBS with Ca[2+] and Mg[2+], followed by incubation in primary antibodies (anti–human ManII rabbit pAb and anti-HA mouse mAb, HA.11 (Covance)) and secondary antibodies (Alexa 568 and Alexa 488) and DAPI (blue) to stain nuclei. Cells were mounted using Fluoromount (SouthernBiotech). Immunofluorescent images were digitally acquired on an inverted microscope (Axiovert 200M; Carl Zeiss, Inc.) coupled to a 12-bit cooled charge-coupled device camera (AxioCam MRm Rev. 3; Carl Zeiss, Inc.) controlled by Axiovision software (AxioVs40, version 4.7.2.0; Carl Zeiss, Inc.), using a 100x/1.3 NA oil immersion objective (EC Plan-NeoFluar; Carl Zeiss, Inc.), and saved as tiff files (1388 × 1040, 8 bit). All pictures were treated identically using Adobe Photoshop to remove background and adjust contrast. This image corresponds to Figure 6D, bottom panel (merge) in J Cell Biol. 190: 893-910, 2010. Images in Fig 6 include CIL#s 13655, 13656, 13657.
| Spatial Axis | Image Size | Pixel Size |
|---|---|---|
| X | 1388px | 169.333µm |
| Y | 1040px | 169.333µm |