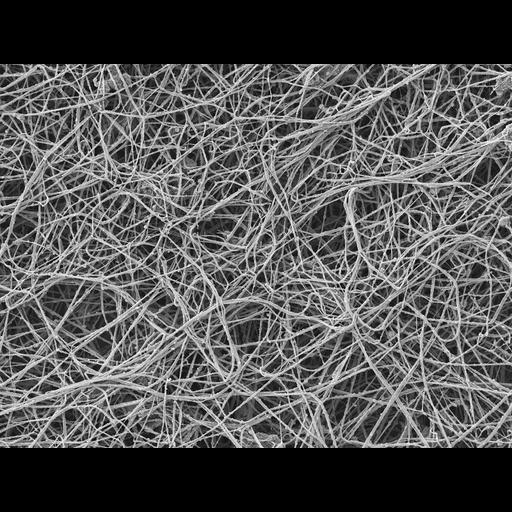
Fibrin clots were generated by incubation of healthy donor plasma with or without SARS-Cov2 Spike proteinin the presence of thrombin. After clot formation, SEM imaging was performed and 4000X images were captured across the sample.
Healthy donor citrated human plasma was diluted 1:3 in 20 mM HEPES buffer, pH 7.4; 15 μl of the diluted plasma was mixed with 15 μl of recombinant trimeric Spike protein that was buffer-exchanged into 20 mM HEPES and137 mM NaCl using Amicon concentrators (100 kDa cut-off) prior to addition to plasma.Low concentration of NaCl was used to maintain Spike solubility and stability.Then, 25 μl of this mixture was pipetted onto 5 mm x 5 mm silicon wafers (Ted Pella) and incubated for 15 minat 37 °C in a humidified tissue culture incubator. Next, 25 μl of a solution of CaCl2 and thrombin in 20 mM HEPESwas added in the center of the wafer and allowed to polymerize at 25 °C for 2 h. Final concentrations were plasma 1:12, 0.9 μM Spike, 0.25 U/ml thrombin, 20 mM CaCl2. Buffer was used instead of Spike for vehicle control. Clots on wafers were placed on ice, washed twice for 10 min each with ice-cold electron microscopy grade 0.1 M cacodylate buffer, pH 7.4,and fixed with cold electron microscopy grade 2% glutaraldehyde (Electron Microscopy Sciences). Samples were rinsed three times for 5 min each in Millipore-filtered, double-distilled water; dehydrated in an ethanol series (20%, 50%, 70%, 90%, 100%, 100% for 2 min each); and critical point dried with CO2. Samples were sputter coated with a thin layer of gold-palladium and imaged with a Zeiss Merlin field-emission scanning electron microscope at 3.0 keV and a secondary electron detector.
SEM imaging and image acquisition were carried out blinded to test conditions. 4000X images were captured across the sample, then were converted to 8-bit with NIH ImageJ (v. 1.50). After pixel to micron scaling, each image was cropped into two or three fields of view (FOV) (8×8 μm) with NIH DiameterJ. Surface plot plug-in ImageJ was used to generatetopographical maps of SEM images. Briefly, the best segmentation algorithm was pre-selected based on side-by-side comparison of images before quantification. The Mixed Segmentation (M1-through M3 options) built in DiameterJ Segment provided the most accurate representation of the fibers to be quantified. The same segmentation method and variant was used across all test conditions and images. Each segmented image was manually edited with ImageJ to ensure complete representation of segmented fibers. Edited images were batch processed with DiameterJ 1-108 (orientation analysis not selected). Fiber radius and intersection densities were collated from each batch.